Cellpin Label Transfer Tutorial#
Cellpin learns a robust embedding of scRNA-seq reference data, which makes it well-suited for label transfer: assigning cell-type annotations from an annotated reference to unlabelled spatial cells.
This notebook demonstrates:
Section |
Description |
|---|---|
A — Standard |
Train cellpin and transfer cell-type labels from a scRNA reference to spatial data |
Before running: update the file paths in the Load data cell to point to your own .h5ad files.
Setup#
import cellpin
import torch
import scanpy as sc
import numpy as np
import pandas as pd
import matplotlib.pyplot as plt
from time import time
Helper functions#
sample_square_from_center — subsamples a spatial dataset to a square window centred on a random spot, expanding until target_cells cells are included. Used here to keep runtime manageable on large Xenium datasets.
def sample_square_from_center(
    adata,
    target_cells=50000,
    coord_key="spatial"
):
    coords = adata.obsm[coord_key]

    center = coords[np.random.randint(coords.shape[0])]
    x0, y0 = center

    d = 100

    while True:
        mask = (
            (coords[:,0] >= x0-d) &
            (coords[:,0] <= x0+d) &
            (coords[:,1] >= y0-d) &
            (coords[:,1] <= y0+d)
        )

        if mask.sum() >= target_cells:
            break

        d *= 1.2

    return adata[mask].copy()
Load data#
Both objects need raw integer counts — either in .X or in a named layer (set LAYER accordingly).
sc_adata: single-cell reference atlas (full or highly-variable gene space)sp_adata: spatially-resolved dataset (panel genes only)
Example data used here:
Single-cell: Human Cell Lung Atlas (HCLA) core atlas — 4,000 HVGs
LAYER = "counts"      # layer with raw integer counts; set to None to use .X
CELL_TYPE_COL = "ann_level_3"  # column in sc_adata.obs with cell type labels

sc_adata = sc.read_h5ad("HCLA_core/4cb45d80-499a-48ae-a056-c71ac3552c94_hvg4000.h5ad") #adapt path to your own atlas
sc_data_counts = sc_adata.raw[sc_adata.obs_names, sc_adata.var_names] #object did not contain counts so we need to copy from anndata.raw
sc_adata.layers["counts"] = sc_data_counts.X
sc_adata.var_names = sc_adata.var["feature_name"] #update var names to match spatial data
sc.pp.subsample(sc_adata, n_obs=100_000, random_state=0) #subsample for speed
sp_adata = sc.read_h5ad("10X_Xenium/Lung_none_diseased/processed_sampleLung_10X_BC.h5ad") #adapt path to your own spatial data
sc.pp.filter_cells(sp_adata, min_genes=10)
sp_adata = sample_square_from_center(sp_adata, target_cells=50_000) #subsample for speed
Data setup#
setup_data aligns gene spaces and returns dataset objects used for training and inference.
sc_dataset, sp_dataset = cellpin.pp.setup_data(
    sc_adata, sp_adata, layer=LAYER,
     batch_key="dataset")
============================================================
[cellpin.pp.setup] Setting up CellPin datasets
============================================================
[cellpin.pp.setup] sc_adata :  100,000 cells  ×    4,000 genes
[cellpin.pp.setup] st_adata :   59,046 cells  ×      392 spatial genes
[cellpin.pp.setup] Expression read from layer='counts'
[cellpin.pp.setup] WARNING: 156 spatial gene(s) not found in sc_adata — will be dropped:
  ['ACE', 'ACE2', 'ACTR3', 'ADAM17', 'ADGRE5', 'AIF1', 'AK1', 'ALDH1A3', 'ALOX5', 'ANAPC16'] ...
[cellpin.pp.setup] Panel    : 236 genes overlap (60.2% of spatial genes retained)
[cellpin.pp.setup] Imputed  : 4,000 genes total in sc space (3,764 genes to impute, not in panel)
[cellpin.pp.setup] sc_dataset: 100,000 cells, 4,000 genes total, 236 panel genes
[cellpin.pp.setup] st_dataset: 59,046 cells, 236 panel genes
A) Standard cellpin — model.fit()#
Two-stage training:
Stage 1 — pretrain: full-gene VAE (ELBO on all reference genes)
Stage 2 — distillation: panel encoder aligned to the full encoder via MSE + SNN + reconstruction from panel embedding
A.1 — Train#
t0 = time()
model_A = cellpin.CellPin(sc_dataset)
model_A.fit(
    sc_dataset,
    pretrain_epochs=50,
    train_epochs=60,
    save_checkpoints=False,
    batch_size=512,
)
time_A = time() - t0
print(f"Training time: {time_A / 60:.2f} minutes")
Epoch 49: 100%|██████████| 157/157 [00:07<00:00, 20.52it/s, v_num=19, val_loss=637.0, val_reconst_loss=612.0, val_kl_loss=23.30, val_kl_l_loss=2.490, val_pearson_loss=0.673, train_loss=636.0, train_reconst_loss=610.0, train_kl_loss=23.80, train_kl_l_loss=2.460, train_pearson_loss=0.664]
Epoch 59: 100%|██████████| 157/157 [00:08<00:00, 18.85it/s, v_num=13, val_loss=730.0, val_reconst_loss=615.0, val_kl_loss=61.20, val_kl_l_loss=2.660, val_distill_loss=0.0602, val_snn_loss=1.460, val_inv_loss=0.184, val_snn_temperature=0.0649, val_pearson_loss=0.670, train_loss=728.0, train_reconst_loss=612.0, train_kl_loss=60.90, train_kl_l_loss=2.600, train_distill_loss=0.0712, train_snn_loss=1.760, train_inv_loss=0.220, train_snn_temperature=0.0649, train_pearson_loss=0.656]
Training time: 14.83 minutes
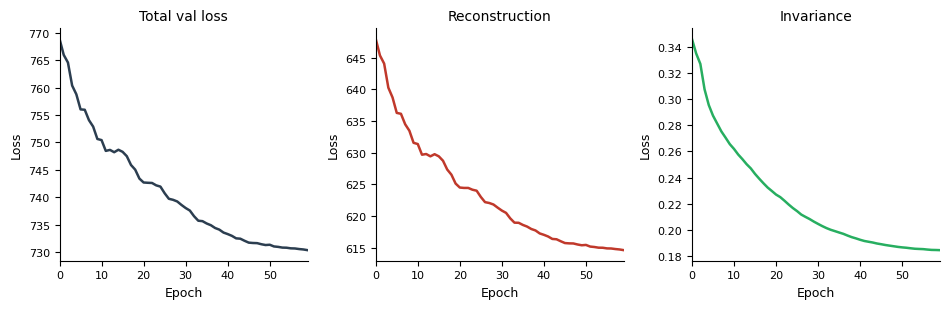
A.2 — Loss curves#
model_A.pl.losses(smooth=5)
A.3 — Label transfer#
Pass confidence_threshold= to label_transfer() to assign a low-confidence label (e.g. "unknown") when the predicted class probability falls below a given threshold.
#Imputation not necessary for label transfer but we do it here just to plot values below:
dl_A = torch.utils.data.DataLoader(sp_dataset, batch_size=512, shuffle=False)
adata_imputed_A = model_A.impute(
    dl_A,
    obs_adata=sp_adata,
    return_norm=True,
    area_key="cell_area",
    nb_count_samples=20,
    return_int=True)
Embedding and imputing cells (MC, 50 samples)...
[CellPin.impute] Panel gene order confirmed ✓
  [impute] Filling 3764 gene(s) absent from obs_adata layers with sentinel -2.0
  [impute] Filling 3764 gene(s) absent from obs_adata layers with sentinel -2.0
acc_A, adata_annot_A = cellpin.tl.label_transfer(model_A, sc_adata, CELL_TYPE_COL, adata_imputed_A)
[label_transfer] 25 cell type classes
[label_transfer] Train: 80000 | Test: 20000
[label_transfer] Test accuracy: 0.9418
[label_transfer] Annotation complete. Annotations stored in sp_adata.obs['cellpin_annotation']
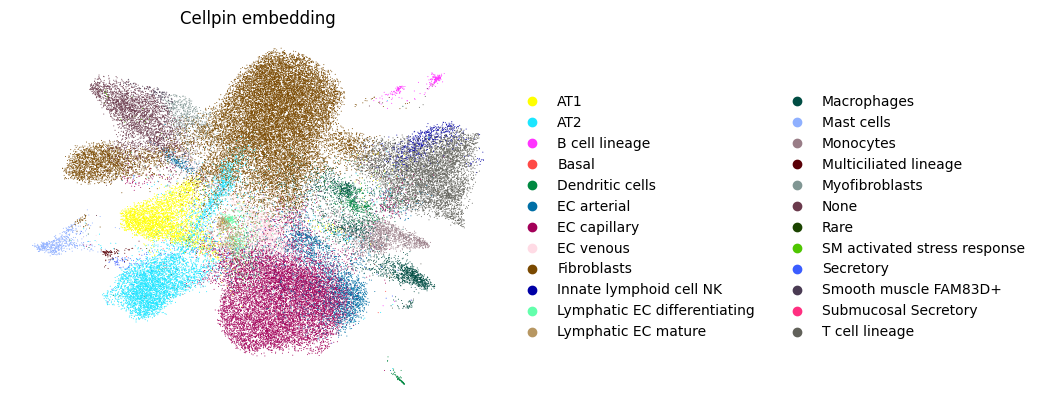
A.4 — UMAP from cellpin embeddings#
Cell embeddings in obsm["X_cellpin"] can be used directly to build a neighbourhood graph and compute a UMAP.
sc.pp.neighbors(adata_annot_A, use_rep="X_cellpin")
sc.tl.umap(adata_annot_A)
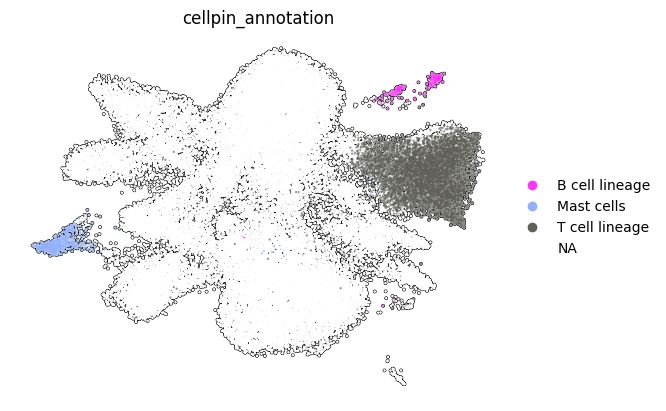
sc.pl.umap(adata_annot_A, color=["cellpin_annotation"],frameon=False, title="Cellpin embedding")
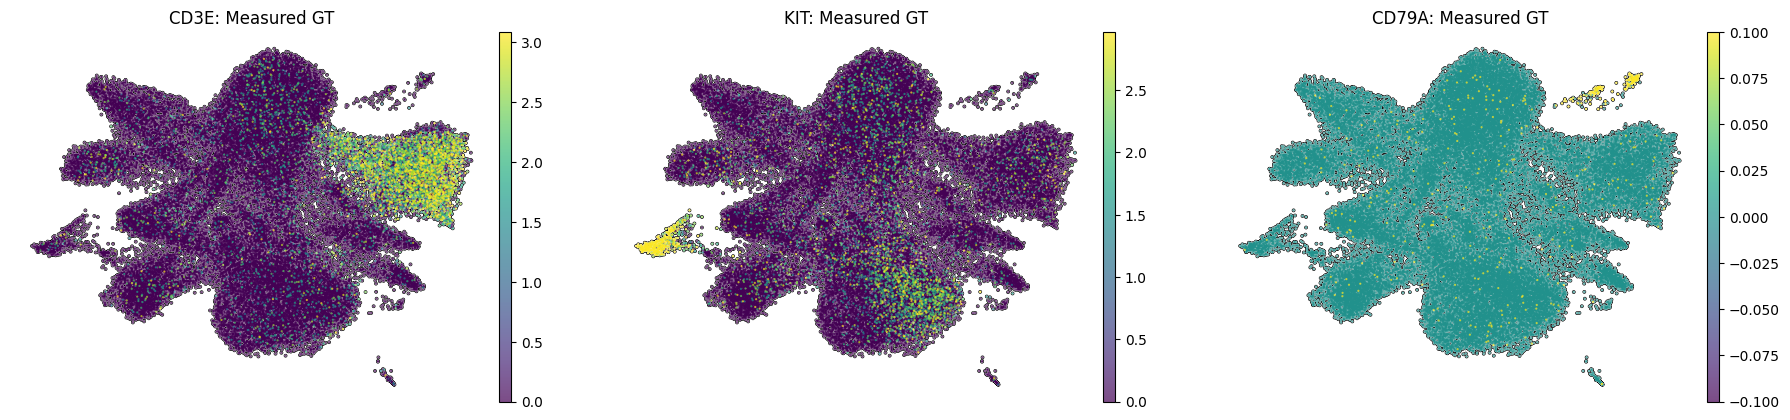
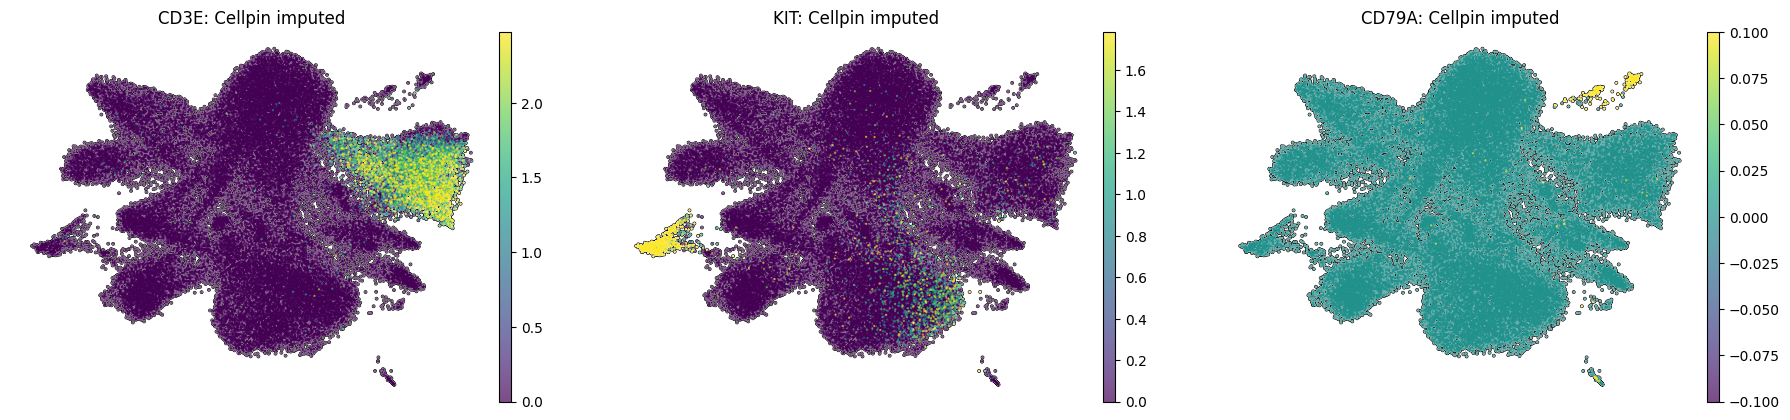
Spatial UMAP examples for a T cell lineage marker (CD3E), a Mast cell marker (KIT), and a B cell marker (CD79A), shown as both measured ground-truth and cellpin imputed expression.
sc.pl.umap(adata_annot_A,color=["cellpin_annotation"],frameon=False,groups=["T cell lineage","Mast cells","B cell lineage"],size=10,add_outline=True,na_color="white")

sc.pl.umap(adata_annot_A,color=["CD3E","KIT","CD79A"],frameon=False,vmax="p99",layer="log1p_norm",add_outline=True,na_color="white",size=10,title=[f"{gene}: Measured GT" for gene in ["CD3E", "KIT", "CD79A"]])

sc.pl.umap(adata_annot_A,color=["CD3E","KIT","CD79A"],frameon=False,vmax="p99",layer="imputed_norm",add_outline=True,na_color="white",size=10, title=[f"{gene}: Cellpin imputed" for gene in ["CD3E", "KIT", "CD79A"]])